Objectives of GreenGaDe
GreenGaDe's central objectives are to evaluate greenhouse gas (GHG) emissions and carbon storage dynamics related to the agricultural sector at national and regional scales in West Africa, to guide national and regional climate change adaptation policies and strategies, and to develop strategies to accelerate the implementation of climate-smart agriculture approaches in smallholders’ farmers. To do so, we aim at:
- Quantifying GHG emitted under different agricultural practices at local, national and regional levels;
- Measuring carbon pool dynamics in agricultural lands and near-natural vegetation;
- Modeling GHG emissions from the agricultural sector at the local, national and regional scale and predicting the potential carbon sequestration in 2030 and 2050;
- Exploring the knowledge and local innovations favoring GHG emissions and carbon sequestration.
Greenhouse gases (GHG) emitted from agricultural landscapes
Greenhouse gases are gases in the atmosphere with the property of absorbing and emitting infrared radiation, ultimately causing global warming and climate change. Carbon dioxide (CO2), methane (CH4) and nitrous oxide (N2O) are the three primary GHG known for trapping heat in the atmosphere (Fig. 1) that are emitted from agricultural landscapes. Carbon dioxide accounts for about 76 percent of global human-caused emissions. Once emitted into the atmosphere, 40 percent still remains after 100 years. Although methane persists in the atmosphere for far less time (about a decade), it is much more potent in terms of the greenhouse effect. In fact, its global warming potential (GWP) is 25 times greater than that of carbon dioxide over a 100-year period. Globally it accounts for approximately 16 percent of human-generated greenhouse gas emissions. Finally, nitrous oxide is also a powerful greenhouse gas, with a GWP 300 times that of carbon dioxide on a 100-year time scale, and it remains in the atmosphere about a century. It accounts for about 6 percent of human-caused greenhouse gas emissions worldwide.
Land-use and land-use change, including land clearing for agricultural production, and agricultural production itself, are major sources of GHG emissions. While soil, plant, and animal respiration, burning of fossil fuel, burning of biomass, and deforestation are the major natural and anthropogenic sources of carbon dioxide, methane emission sources include wetlands, paddy fields (from rice production), livestock activities, and landfills. Nitrous oxide emissions occur mostly through agricultural activities associated with increased use of synthetic fertilizers, deposition of animal excreta (urine and dung), disproportionate application of manure to farmlands, and inefficient use of irrigation water. With the predicted population growth, agricultural intensification and other forms of land-use changes are expected to accelerate GHG emissions in West Africa. On the other hand, preserving carbon pools in soil and vegetation could help reduce GHG emissions. Thus, it is highly relevant to quantify both carbon pool dynamics and GHG emitted under different land-use practices, and to improve our understanding of GHG dynamics in the region.

Study Area and Study Design
In the GreenGaDe project, the effect of land-use change and climate change on carbon pool dynamics and GHG emissions will be assessed with two complementary approaches. Specifically, we will combine a space-for-time substitution approach with a direct, experimental evaluation of GHG emissions. The space-for-time substitution adopts spatial data for appraising temporal dynamics; with this approach we aim to quantify the joint effects of climate change and land-use change on GHG emissions and carbon pools from all relevant ecosystem compartments (soil, woody and herbaceous vegetation). With our experiments, we will directly measure GHG emissions from croplands under different cultivation techniques, and from the livestock sector.
Approach 1: Space-for-time substitution
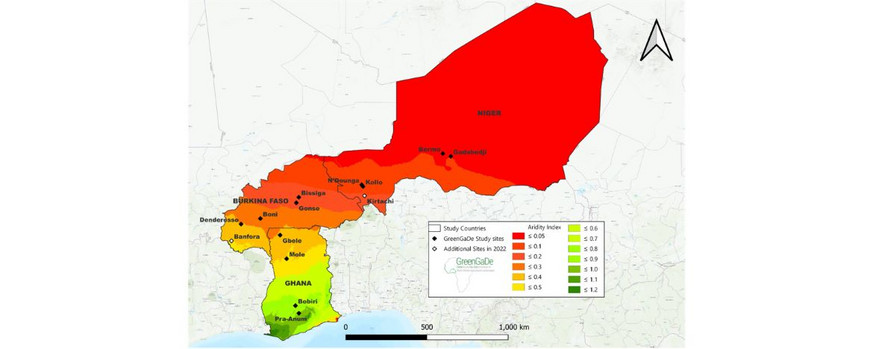
To capture joint effects of climate change and land-use change on GHG emissions and carbon pools, the GreenGaDe project has established a so-called ‘crossed’ space-for-time substitution, as done in previous studies of WASCAL (Ferner et al., 2018; Guuroh et al., 2018). Predicted changes in climate conditions are assessed by sampling along the steep gradient of climate conditions present in West Africa. Here, twelve sites have been selected in the three participating GreenGaDe countries (Burkina Faso, Ghana, and Niger) which are arranged along the steep regional climate gradient in West Africa, ranging from moist forest areas of Ghana through the savannas of Ghana and Burkina Faso to the Sahel region of Niger (Fig. 2). This gradient can be expressed at best by the globally accepted Aridity Index (version 3) that is based upon the FAO-56 Penman Monteith equation for reference evapotranspiration (ET0) calculated for the entire globe (Zomer et al. 2022). Therein, our twelve selected sites cover a range of aridity from 0.09 to 1.03.
Within each site, we are interested in different land-use types, namely croplands, rangelands, and near-natural forests, that span the second gradient of our space-for-time substitution representing common land uses in our study areas from a pure anthropogenic land cover to naturally maintained ecosystems. Per land-use type, ten observation plots have been laid out for interdisciplinary data acquisition (Fig. 1.3). As topographic position is – on a local scale – besides land-use practices one of the main factors driving ecosystem-level carbon pool dynamics, equal numbers of plots were set up in the lowlands and highlands in each land-use type. For the croplands, maize (sorghum in Niger) and rice were selected as the main crops in each study site to assess GHG emissions and carbon pools from agricultural practices.

While plant and soil sampling are taking place on each site based on the above-mentioned study design (Fig. 3), GHG measurements are – due to constrains in finances and manpower – only conducted within one site per country (Bobiri in Ghana [AI: 0.92]; Gonsé in Burkina Faso [AI: 0.27]; N’Dounga in Niger [AI: 0.17]). The site selection is based on logistical constraints because repeated measurements every 2 weeks over at least 6 months with all the equipment for GHG emissions was only feasible in the site closest to the partner institution of each country. Within this site, the measurements are taken in two of the selected plots per topography within each land-use type. Additionally, and in order to better depict different land-use systems, the consortium decided to add a second crop type to the reduced design investigating rice fields besides maize and millet fields. The cultivation of rice is known to be a source of greenhouse gases and is therefore especially interesting to study. In contrast to the maize and millet fields, however, rice fields are only found on topographically lower situated fields (for details see individual report of WP 5).

Approach 2: Experimental assessment of GHG emissions due to agricultural activities
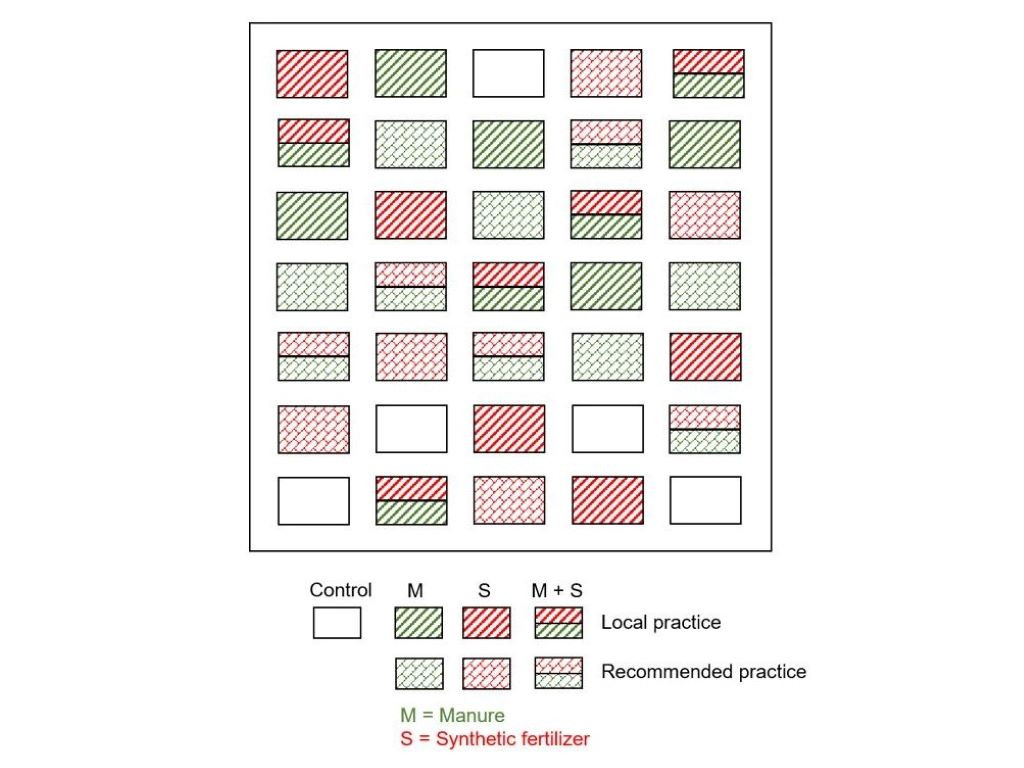
To directly measure GHG emissions from croplands under different cultivation techniques, a controlled fertilizer experiment will be set up in Burkina Faso and Niger. GHG measurement will be conducted in two common crop types (rice and maize / millet) under three fertilizer types – (1) synthetic fertilizer only; (2) manure only; and (3) a combination of manure and synthetic fertilizer – and two application rates (farmers’ application rates, and recommended application rates; see the WP 5 report for details) (Fig. 4). Moreover, the emission of carbon dioxide and methane as two important GHG emitted from the livestock sector will be measured.
In Niger, the selected crop is millet as it is the most rainfed cultivated crop while in Burkina Faso, the experiment is set-up on maize fields as most common crop. The consideration of repeating the experiment on rice fields in order to investigate the same crop types in both approaches had to be discarded due to a limited number of collars and the frequent measurements required with a limited manpower for Burkina and Niger. In both countries, in order to spare travel and transportation costs the project partners at UJKZ and UAM decided to set up their experiment near each institution which enables frequent GHG measurements.
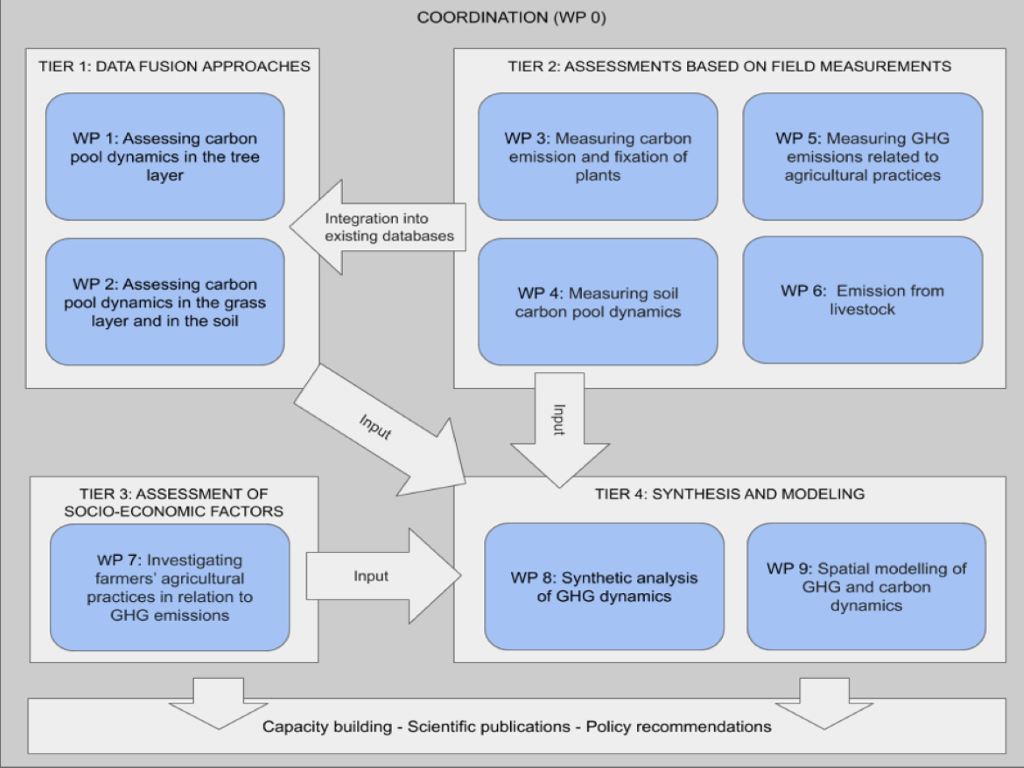
Project Structure
Understanding GHG and carbon pool dynamics requires a highly integrated, interdisciplinary approach. To do so, the GreenGaDe project integrates research from the natural and social sciences. Therewith, GHG emissions and carbon pools will not only be quantified, mapped and modelled under different agricultural practices, but also their awareness and perception will be analyzed from various stakeholders (from policy-makers to land owners). These investigations will be carried out by using different approaches in a four-tiered study design (Fig. 5). In Tier 1 (WP 1 and WP 2), data fusion approaches will be performed. Therefore, existing datasets on carbon pools in soil and biomass will be compiled, and subsequently analysed for carbon pool dynamics (C sequestration and losses) along the climate and land-use gradients.
In Tier 2 (WPs 3-6), the emission and fixation of various carbon pools and greenhouse gases (including CO2) will be directly measured in the three West African countries Niger, Burkina Faso and Ghana along a transect that covers the entire climatic conditions in West Africa. The collection of empirical data is divided into four work packages that aim to understand the carbon storage potential as well as carbon and nitrogen dynamics of selected ecosystems using observational field research. Tier 3 focuses on the assessment of socio-economic factors, specifically agricultural practices and innovations of farmers (WP 7) that influence GHG emissions across various farming traditions and systems. Finally, in Tier 4, data generated in all previous WPs will be the basis for data-based and model-based synthetic analyses. These include the development and assessment of land-use scenarios (WP 8 and WP 9).