A Graphical Model For Three-Voiced Georgian Music
The basic idea behind the following model for chord progressions is that a song can be described as a temporal sequence of melodic and/or harmonic states. In the case of traditional three-voiced Georgian music, these states are chords consisting of three notes (bass, middle, and top voice) and a duration. If one imagines that each unique chord in a song is located on an imaginary landscape, which is referred to as chordscape, the sequence of melodic and/or harmonic states in a song becomes a trajectory (a path) on this chordscape, which is referred to as song path.
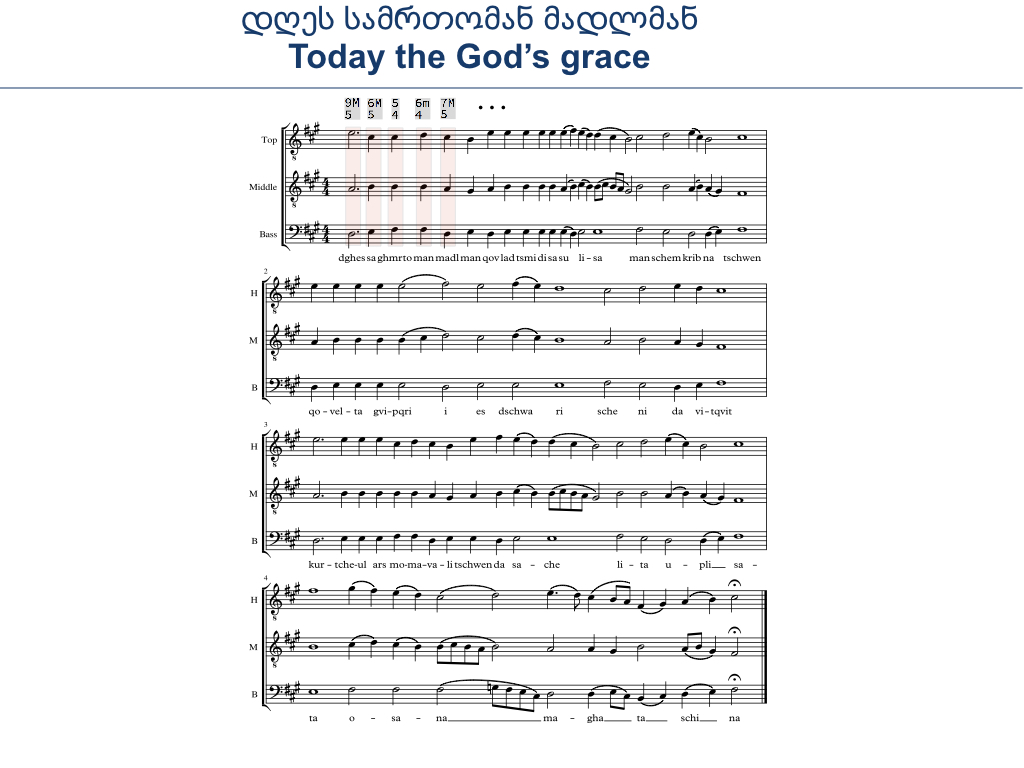
Below this is illustrated for the chant Dgres saghrmto man madlman (Today is the God’s grace).
In order to analyse the chord progressions in different scores, which might cover very different pitch ranges, they have to be first made comparable. This is done in the present example by simply considering only the intervals above the bass voice of each chord. This means that - in a first attempt - the melody of the bass voice and its absolute pitch are ignored.
As a consequence, the sequence of chords becomes first a major 9th on top of a fifth, followed by a major 6th on top of a fifth, and so forth. For illustration, just the first few chord labels are shown, but it should be obvious how the sequence continues.
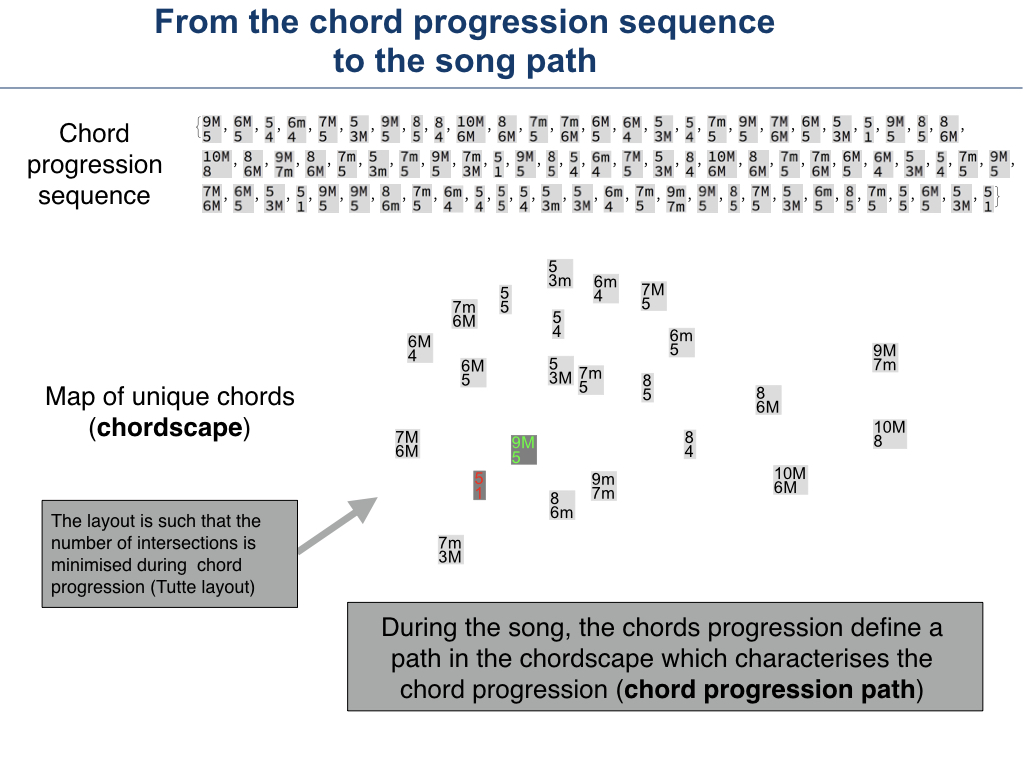
The chord progression sequence for the whole song is shown in the upper part of the figure on the right. Subsequently, all double labels are dropped and the remaining labels are distributed on a plane. This generates a landscape of unique chords in the song, which in the following is referred to as chordscape.
As a consequence, when the song unfolds, it moves over this chordscape in a way which reflects the chord progression. The corresponding trajectory on the chordscape can be interpreted as the song path. If one chooses a different spatial arrangement of the chords, one will of cause obtain a different trajectory. In such a trajectory there can be a lot of crossing path segments. The amount of crossings depends on the chord arrangement.
In the present case, however, the computer has searched for that arrangement in which the number of crossings is minimised. This has the positive side effect, that the trajectories become simpler and are easier to understand. It also has the effect that those chords which are used more often, have to move to the middle of the map.
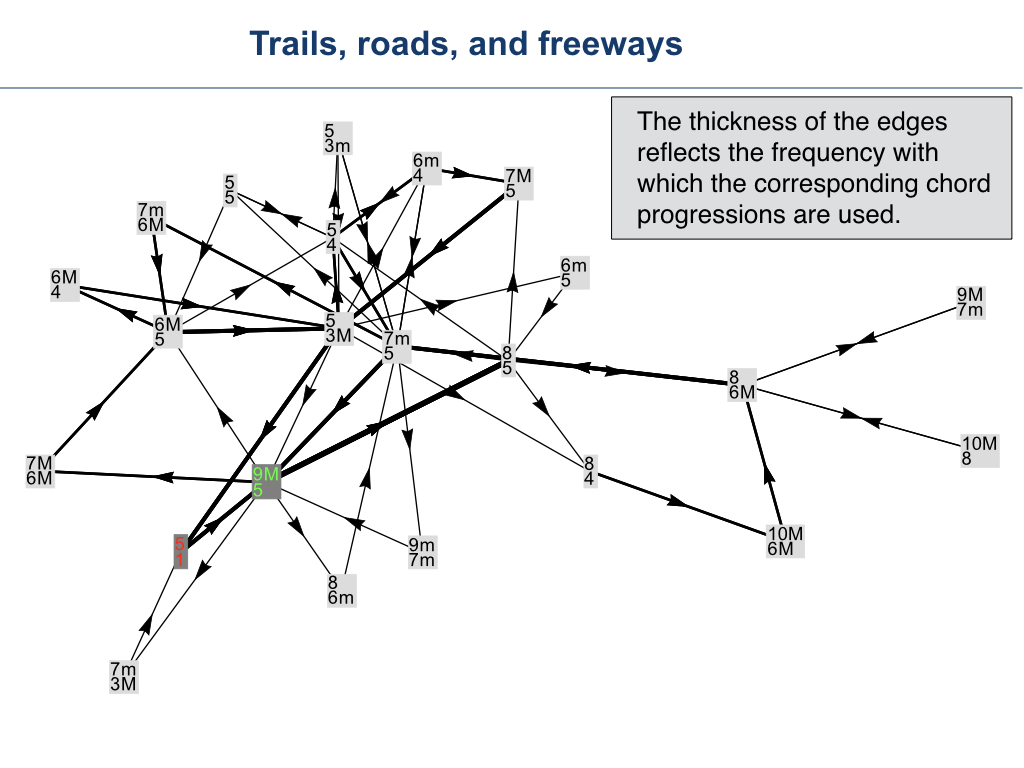
If one plots the thickness of the connections in such a way, that it reflects the frequency with which the corresponding chord progression is used, one obtains the plot on the left.
This graph now contains a lot of information about the harmonic structure and the chord progression in the song. As a consequence of the layout, those chords which are more often used than other move into the center of the plot. One can also immediately get an impression about the frequency with which particular chords and chord transitions are used in the song.
Most importantly, however, is the fact that this graph now contains all the information about the chord progressions in the song in an intuitive graphical, yet still quantitative way, which can directly be used for comparison of different scores. The ideas discussed above are further explored and described in the publications below.
References
Scherbaum, F., Arom, S., & Kane, F. (2015). On the feasibility of Markov Model based analysis of Georgian vocal polyphonic music. In Proceedings of the 5th International Workshop on Folk Music Analysis, June 10-12, 2015, University Pierre and Marie Curie, Paris, France (pp. 94–98). (PDF)
Scherbaum, F., Arom, S., & Kane, F. (2016). A graph-theoretical approach to the harmonic analysis of Georgian vocal polyphonic music. Proc. of the 6th International Workshop Folk Music Analysis,15 - 17 June, Dublin/Ireland, 59–60. (PDF)
Scherbaum, F., Arom, S., & Kane, F. (2016). Graphical comparative analysis of the harmonic structure of the Vl. Akhobadze corpus of Svan songs. 8th International Symposium on Traditional Polyphony, 26–30 Sept, 18 pp. (PDF)
Arom, S., Scherbaum, F. , & F. C. Darras (2018). Structural Analysis and Modeling of Georgian and Medieval Polyphonies. 9th International Symposium on Traditional Polyphony, 30 Oct - Nov.3. (PDF)