Synchronisation of heartbeat rates during singing
The effect of music on the human body is a phenomenon whose underlying processes are still poorly understood. Nevertheless, growing experimental evidence attests that music might actually modulate physiological functions and elicit biochemical effects (Cervellin & Lippi, 2011). The human heart plays a central role in this context. Together with the respiratory system, with which it is coupled by an effect called respiratory sinus arrythmia (RSA) (Ludwig, 1847), the heart functions as the engine of our lives by keeping our body's energy supply running. In addition, it acts as a sensory organ in a physiological sense (Shepherd, 1985), but also on a metaphorical level. For example, we speak of “something going to our heart” when it touches us emotionally.
Chew and coworkers (2020) have shown that "Every heart dances to a different tune”, in other words that the reaction of the heart to music is very subjective. One the other hand, it has also been found that the heartbeat rates of singers in a choir can synchronize, probably in connection with their breathing. Müller and Lindenberger (2011) describe phase synchronization of respiration and heart rate variability (HRV) associated with choir singing in unison and in canon. In a study by Vickhoff et al. (2013) it was demonstrated that the HRV of choir singers was significantly affected by the structure of the sung music. Unison singing for example of regular song structures makes the hearts of the singers accelerate and deccelerate simultaneously (Vickhoff et al., 2013).
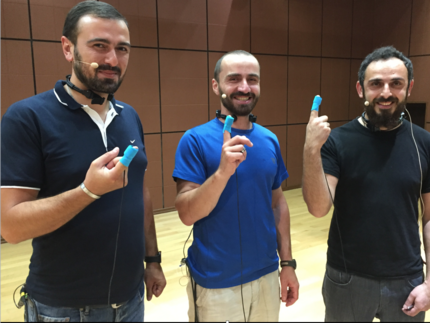
We wanted to test if these effects could also be observed for more complex song structures. In July 2019, together with Lasha Chkhart’ishvili (bass voice), Guram Guntadze (middle voice), and Mamuka Siradze (top voice) from the trio Khelkhvavi in Ozurgeti, we conducted an experiment to monitor the singers' heartbeat rates during singing. During a recording session which lasted about two hours, we augmented our recording equipment by (optical) pulse sensors taped to the index fingers of the singers. Heartbeat-, audio-, and video- channels were time-synchronized via bluetooth generated time codes (Tentacle Sync).
For the analysis of the recordings, we wanted to make sure that the singers were already well tuned to each other but also that the song is sufficiently complex. These two conditions let us choose the Gurian folk song Chven Mshvidoba, which was sung close to the end of the session. To watch the video of the recording of this song click here.
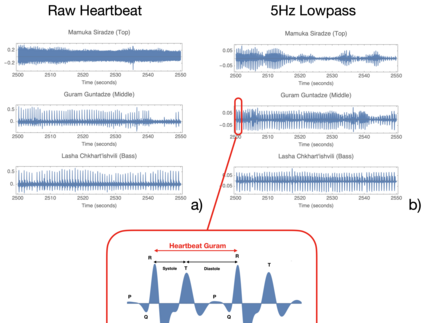
The individual pulse sensor recordings are subject to quite different amounts of high frequency noise. After lowpass filtering, the signal-to-noise ratio visibly increases, in particular for the recording of the top voice singer. Nevertheless, the heartbeat recording quality still differs strongly for the individual singers, possibly due to differences in the individual sensor couplings.
However, for all of the singers, one can clearly recognize all the typical deflections seen on an electrocardiogram (ECG or EKG). The so-called QRS complex, in panel c) amplified for the middle voice singer Guram, is the most visually obvious part of the tracing and corresponds to the activation of the ventricles of the human heart and the contraction of the large ventricular muscles. The systole is the tightening and thus blood outflow phase of the heart in contrast to the diastole, which defines the relaxation and thus blood inflow phase of the cardiac cycle.
Since the quality of individual pulse sensor recordings differs as a function of time but also depending on the achieved sensor coupling, the extraction of a continuous sequence of heartbeats constitutes a challenging task.
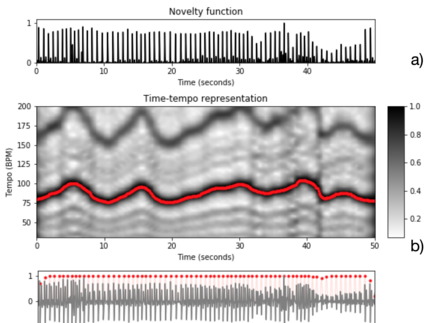
In the present case, the problem was approached using the concept of Predominant Local Pulse (PLP) functions (Grosche and Müller, 2011; Müller, 2015; 2020 ) for which the main constituents are shown in the figure to the right. The novelty function (Müller, 2015; 2020 ) describes local temporal changes in the signal properties of the original heartbeat recording. It provides the basis for the calculation of a time-tempo representation, the so-called tempogram (Müller, ibid.).
The key idea behind the tempogram concept is to locally compare the novelty curve with windowed sinusoids. Based on this idea, for each time position a windowed sinusoid is calculated that best captures the local peak structure of the novelty function. Instead of looking at the windowed sinusoids individually, the crucial idea is to employ an overlap-add technique by accumulating all sinusoids over time.
As result, one obtains a single function that can be regarded as a local periodicity enhancement of the original novelty function. Revealing predominant local pulse (PLP) information, this representation is referred to as a PLP function. The PLP function can be regarded as a pulse tracker (in our case the heartbeat) that can adjust to continuous and sudden changes in tempo as long as the underlying novelty function possesses locally periodic patterns (Müller, ibid.).
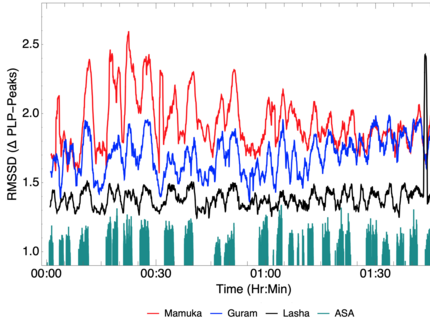
In order to quantify the heart rate variability (HRV) of the singers, we followed the work of Vickhoff et al. (2013) and Wang and Huang (2013) and chose RMSSD, which is defined as the root mean square of successive normal to normal RR intervals (Wang and Huang, 2013). Specifically, we calculate RMSSD as the root mean square of successive predominant local pulse (PLP) peaks. To get a rough view of the entire recording session, a window length of 30 seconds was chosen for the RMS calculation. This results in sufficiently smooth curves which enable the comparison of the individual singers but still allows to see some details. The time stamp of the time series is corrected for the averaging.
There is a strong correlation between the RMSSD trajectories of the individual singers during the whole recording session as can be seen in the figure to the left. This means that the hearts of the singers accelerate and decelerate simultaneously on the time scale given by the averaging distance of 30 seconds. A likely explanation is the coupling of HRV to respiration (cf. Vickhoff et al., 2013). Because at this long time scale there should be a correlation between singing or not singing and the respiration, and via respiration also with heart rate activity. In other words, there should be a correlation between the RMSSD trajectories and phases where the singers were singing and when they were quiet or just talking. This can indeed be seen from the comparison of the RMSSD trajectories with the average singers activity (ASA), which is calculated by thresholding the sum of the individual RMS amplitudes of the larynx microphones.
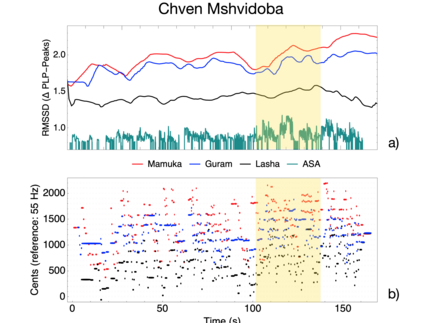
For a more detailed analysis, we selected the Gurian folk song Chven Mshvidoba, which was sung close to the end of the recording session. For its analysis we chose a shorter time window (10 sec) for the RMS calculation in order to be able to perceive more detailed variations in heart rate variability. In particular the two upper voices (Guram and Mamuka) show a clear correlation between their RMSSD trajectories for the duration of the whole song. This means that the hearts of Guram and Mamuka accelerate and decelerate more or less simultaneously on the time scale given by the averaging distance of 10 seconds. In contrast, the RMSSD trajectory of the bass voice singer (Lasha) shows less amplitude variations and no clear correlation to either the middle or the top voice.
These observations are consistent with the dynamics of the song, since the interaction between the two upper voices is the most dynamic, especially during the time window marked in yellow, while the bass voice has a less dynamic, more supporting role. During the highlighted time window, the ASA curve for the two top voice singers shows rising and falling phases which are presumably also reflected - with a slight time delay - in the breathing activity and then, via the RSA mechanism (Vickhoff et al., 2013), in the synchronized heart rate accelerations and deccelarations of Guram and Mamuka. In the video of the recording (see above), one can observe how the dynamics of particularly the two top voice singers jointly increases towards the end of the song. This goes hand in hand with an overall pitch rise of all three voices towards the end of the song which can be seen in the bottom panel.
These results are quite encouraging and suggest that there is a lot of new and interesting information to be gained from the joint use of different sensor types during ethnomusicological recording sessions.
References
Cervellin, G., & Lippi, G. (2011). From music-beat to heart-beat: A journey in the complex interactions between music, brain and heart. European Journal of Internal Medicine, 22(4), 371–374. doi.org/10.1016/j.ejim.2011.02.019
Chew, E. (2020). Every heart dances to a different tune. ScienceDaily.
Chew, E. (2020). Elaine Chew’s Piano Blog. Retrieved from elainechew-piano.blogspot.com/2013/05/upcoming-projects.html
Grosche, P., & Müller, M. (2011). Extracting Predominant Local Pulse Information From Music Recordings. IEEE Transactions on Audio, Speech and Language Processing, 19(6), 1688–1701. doi.org/10.1109/TASL.2010.2096216
Ludwig, C. (1847). Beiträge zur Kenntnis des Einflusses der Respirationsbewegungen auf den Blutumlauf im Aortensystem. Arch. Anat. Physiol., 13, 242–302.
Mauch, M., Cannam, C., Bittner, R., Fazekas, G., Salamon, J., Dai, J., … Dixon, S. (2015). Computer-aided Melody Note Transcription Using the Tony Software : Accuracy and Efficiency. In Proceedings of the First International Conference on Technologies for Music Notation and Representation (p. 8).
Müller, M. (2015). Fundamentals of Music Processing: Audio, Analysis, Algorithms, Applications. Springer.
Müller, M. (2020). An Educational Guide Through the FMP Notebooks for Teaching and Learning Fundamentals of Music Processing, submitted, 1–40.
Müller, V., & Lindenberger, U. (2011). Cardiac and respiratory patterns synchronize between persons during choir singing. PloS One, 6(9), e24893. doi.org/10.1371/journal.pone.0024893
Sanyal, S., & Nundy, K. K. (2018). Algorithms for Monitoring Heart Rate and Respiratory Rate From the Video of a User’s Face. IEEE Journal of Translational Engineering in Health and Medicine, 6(February). doi.org/10.1109/JTEHM.2018.2818687
Shepherd, J. T. (1985). The heart as sensory organ. J. Am. Coll. Cardiol., 6(1), 83B-87B.
Vickhoff, B., Malmgren, H., Aström, R., Nyberg, G., Ekström, S.-R., Engwall, M., … Jörnsten, R. (2013). Music structure determines heart rate variability of singers. Frontiers in Psychology, 4(July), 334. doi.org/10.3389/fpsyg.2013.00334
Wang, H. M., & Huang, S. C. (2012). SDNN/RMSSD as a surrogate for LF/HF: A revised investigation. Modelling and Simulation in Engineering, 2012. doi.org/10.1155/2012/931943
Additional processing information:
www.audiolabs-erlangen.de/resources/MIR/FMP/C6/C6.html
www.audiolabs-erlangen.de/resources/MIR/FMP/C6/C6S2_TempogramFourier.html
www.audiolabs-erlangen.de/resources/MIR/FMP/C6/C6S2_TempogramAutocorrelation.html
www.audiolabs-erlangen.de/resources/MIR/FMP/C6/C6S3_PredominantLocalPulse.html

